Background:
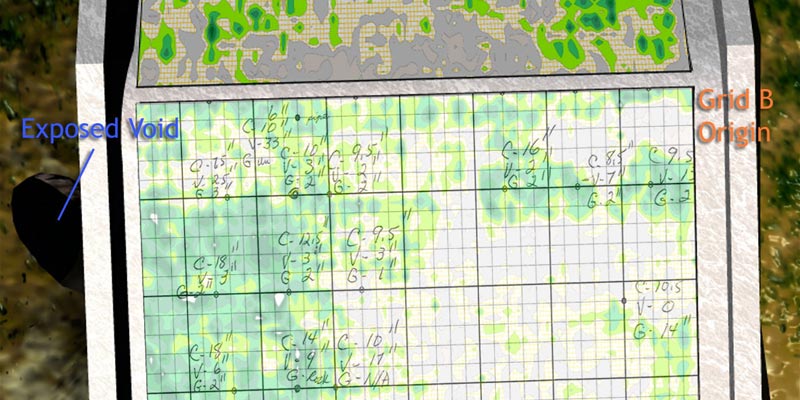
 An irrigation district reservoir spillway was built in the early 1900’s and continues in use today. The spillway is approximately 80’ wide by 70’ long and drops 32 feet in elevation. The structure has had some repair and maintenance over the years, including a new reinforced concrete slab placed over the existing slab making the spillway thickness approximate 24” thick. GPR Data LLC was contacted to perform a ground penetrating radar survey for a spillway analysis to determine the presence or absence of air voids under this concrete spillway. A visual inspection of the spillway analysis noted the existing void of considerable size (7 ft. diameter) along the west side of the lower section of the angled spillway.
Technical Approach:
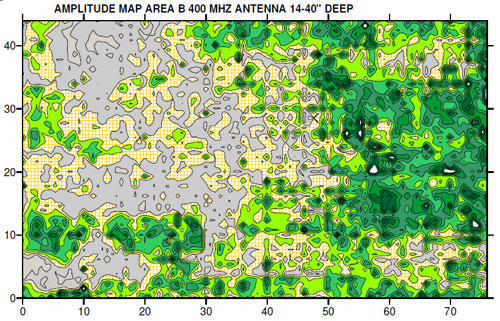
Voids filled with air are readily apparent on a GPR record profile, appearing as extreme negative low amplitude reflections. The objective of this project is to identify and map any such voids using a widespread analysis of low amplitude returns over several grids encompassing the entire spillway. Given the size of the survey area and the level of detail required, an analysis using single GPR profiles alone would have been cumbersome and time-consuming. Instead, the individual profiles were integrated into a 3D file creating a series of plan-view amplitude maps of the negative GPR reflections at various time/depth slices. Amplitude slice mapping creates maps of reflected wave amplitude differences both spatially and with depth within each grid. The reflected measurement recorded digitally exemplifies the changing porosity in subsurface material.
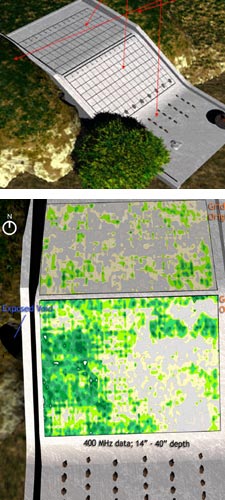
The image below shows an amplitude map of the ground penetrating radar data. The image on the right shows how GPR Data LLC integrated this amplitude map into a 3D model we constructed of the spillway, to present the information in a more accessible manner.
Additional Results:
With our amplitude maps as a guide, the client measured a sample of depths throughout the survey area. At each point, a hole was augered through the concrete, and the depth of both concrete and any void area were recorded. We took their information and superimposed it back over our amplitude map. Click on the small image to view the full-size copy (it will take a while to load) and you can directly see the results.